Dashboards
Action board
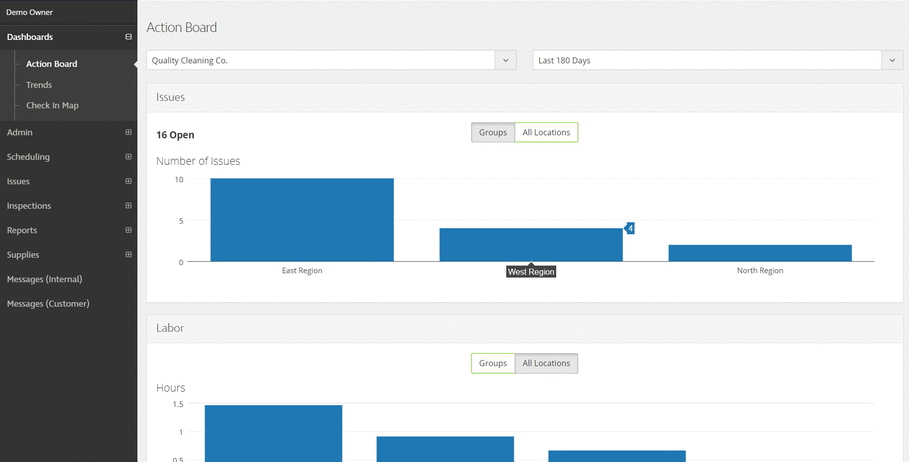
The action board is a real-time management tool that gives you a snap shot of all open complains throughout your organisation. See your organization at a high level and drill down to the details of any location.
You will be able to identify immediately where your most challenging locations are and the performance of your team at all times.

Trends
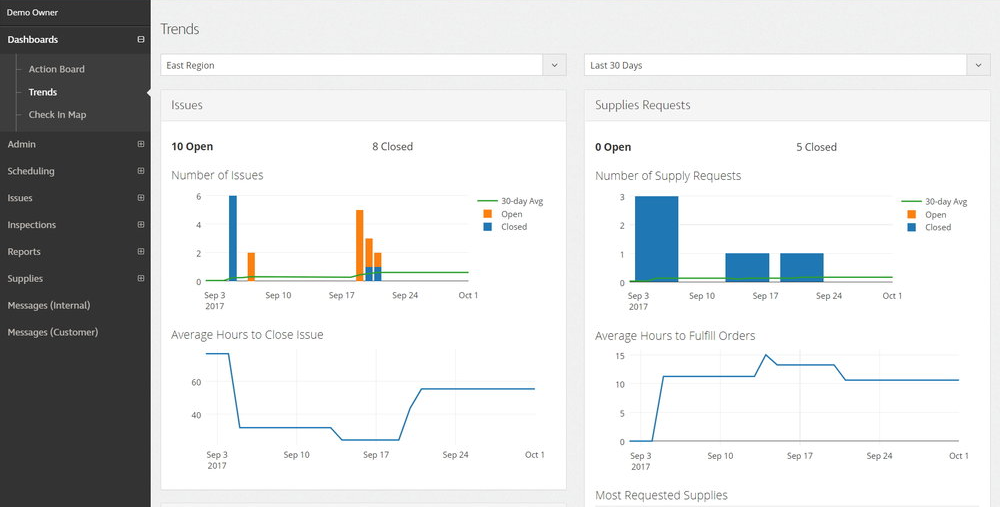
Clean Smarts Trends gives you a series of graphs to see your performance over the last 30, 90, 120, 180, and 365 days.
You will be able to know performance trends on the following metrics. You can view these metrics as an organization or drill down to any other part of your organization, even down to the specific location:
Open and closed complaints with lead times. See how long on average it takes to resolve issues.
Open and closed open supply orders with lead times. See how long it takes to fulfill orders when supplies are requested.
Inspections scores. See the average inspection scores over time and the cleaners associated with high and low inspection scores.

Check in map
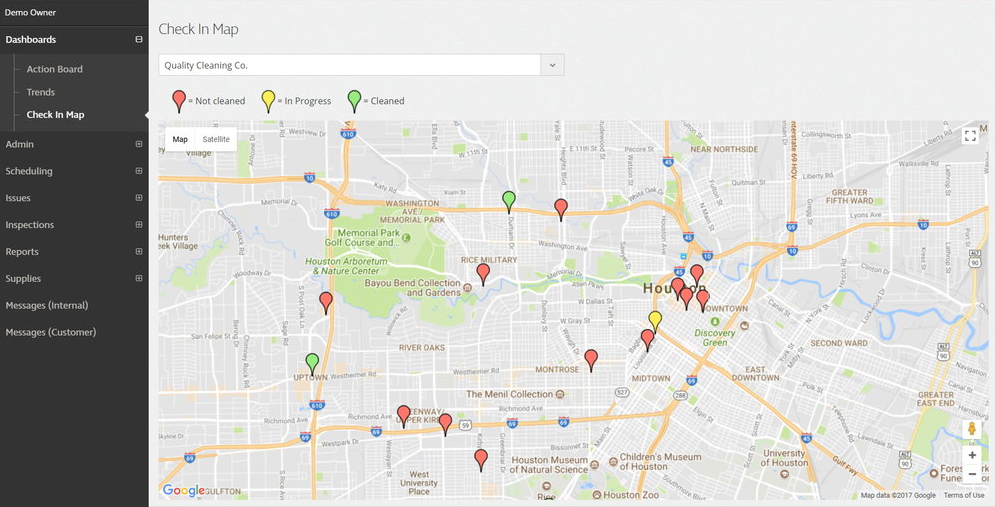
The Sweep Up “Check In Map” tool gives you a real time solution to visually display what is happening at all of your locations. Each location appears as a red, yellow or green marker.
The location turns:
- Red when services have not been started for the day
- Yellow when your teams check in to service the location
- Green when your team checks out of the location.
Clean Smarts can provide as little or as much information as you need when you click on location markers such as:
- Names of operatives
- Times operatives checked in and checked out
- Time expected to be cleaned per your customer contract
- How much time your operative spent at the location
- GPS location when checked in and checked out


Leave A Comment